KVARSince 1988
Andon SystemsALERT, ESCALATION & VISUAL CONTROL

ANDON SYSTEMS — HARDWARE & SOFTWARE

See every problem the moment it happens

Andon systems that put the live status of every machine and line in front of operators, supervisors and management — from a simple push-button and tower lamp to a full cloud-connected software suite.

  • Microcontroller-based embedded circuitry, built for the shop floor
  • Wi-Fi / IoT enabled, with built-in memory for event logging
  • Hardware and software engineered under one roof, in India

THE CONCEPT

What is an Andon system?

Andon is a real-time production status, alert and escalation system that enables operators or machines to immediately signal an abnormal condition, call for assistance, and communicate its status to the concerned personnel. It helps ensure that problems are identified, responded to and resolved quickly, minimizing production loss and downtime.

IN PLAIN LANGUAGE

When something goes wrong on the line — a breakdown, a material shortage, a quality issue — the operator presses a button. A lamp lights up, a display announces it, and the right person is alerted. Nobody has to walk over, phone around, or find out hours later.

  • RRed — stopped. The line needs immediate attention: breakdown, safety issue, or a defect that must not travel further.
  • AAmber — waiting. The line is held up: waiting for material, tooling, quality clearance or an operator response.
  • GGreen — running. Production is normal. The display shows live counts, targets and takt time so everyone knows if the pace is on target.
  • ✓Faster maintenance response — issues are attended when they happen, cutting downtime and raising productivity.
  • ✓Management truth — supervisors and executives see the real performance of machines, not a reconstructed report.

THE KVAR ANDON LADDER

Four levels. Start anywhere, grow any time.

Every plant is at a different point in its digital journey. Each KVAR Andon level is a complete solution on its own — and each one upgrades cleanly into the next, because the hardware and software share one platform.

LEVEL 01Andon BasicPush-Button + Tower Lamp
🔴 CALL · BOARDS

The simplest possible Andon: the operator presses a button, the tri-colour tower lamp lights up, and an optional buzzer sounds. Everyone on the floor sees the line status instantly. No software, no configuration — install it and it works.

  • Rugged push-button call station at the machine or line
  • Tri-colour LED tower lamp (red / amber / green)
  • Optional audible buzzer for immediate attention
  • Wired, plug-and-play installation — running in hours
  • Industrial-grade enclosure built for shop-floor conditions
  • No PC, network or training required

Upgrade path: the same call stations connect to Level 02 display boards later — nothing is thrown away.
LEVEL 02Andon SelectKeypad + LED Display Boards
DELY-INS · LINE 6

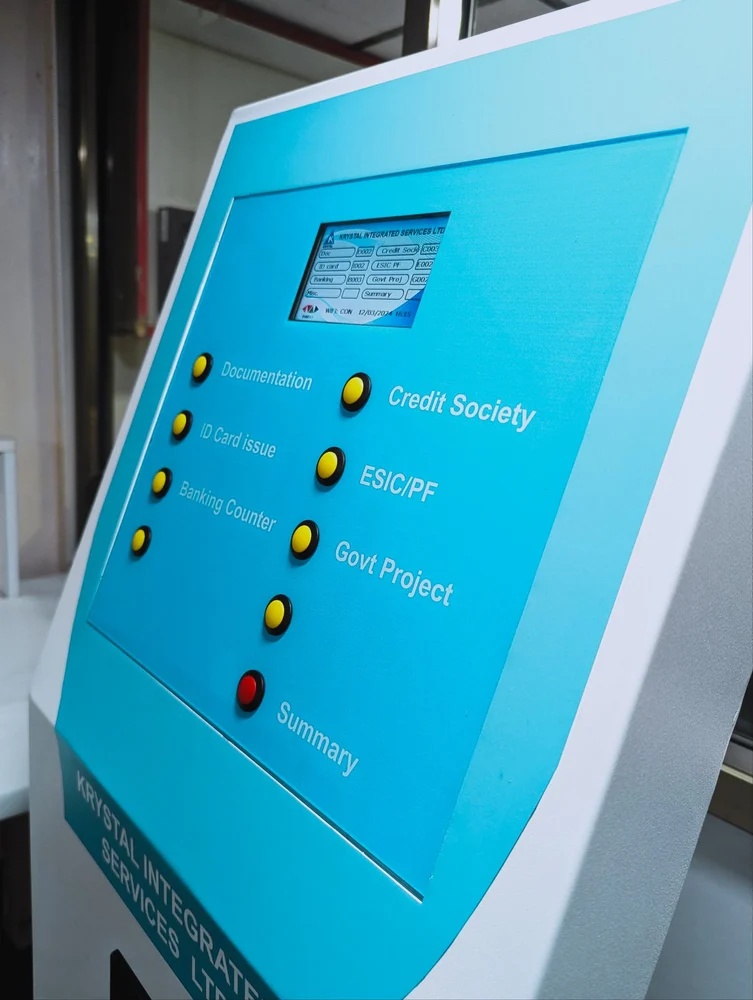
Operators select a call type on a keypad — Maintenance, Quality, Stores, Delivery Inspection and more — and bright LED display boards across the floor announce which line raised which call. Every event is logged automatically in the device’s built-in memory.

  • Operator keypad stations with configurable call codes per department
  • LED dot-matrix display boards, custom-built to your size and layout
  • Tower lamp integration for at-a-glance floor status
  • Built-in memory for event logging — no data lost, even offline
  • Windows-based PC software for log download and analysis
  • Daily / shift-wise / weekly / monthly reports

Why it matters: once calls are categorised and logged, you can see your top recurring problems (a Pareto of downtime reasons) — and fix causes, not symptoms.

LEVEL 03Andon TouchTouchscreen + Routed Alerts
✓ RUN · RESET · 00:43

A touchscreen station at every line lets operators raise detailed, categorised calls. The system routes each alert to the responsible individual by SMS, email and mobile notification — and escalates automatically if nobody responds in time.

  • Industrial touchscreen call stations with your call categories and reason codes
  • Alerts routed person-by-person via SMS / email / mobile notification
  • Auto-escalation matrix: if the first person doesn’t respond, the supervisor is alerted next
  • Raise → Acknowledge → Resolve timestamps captured for every call
  • Central Andon display boards showing live line status and counts
  • Wi-Fi / IoT connectivity — minimal cabling across the plant

What you gain: measured response and repair times — MTTA and MTTR in plain numbers, per line, per shift, per person.

LEVEL 04Andon SuiteFull Software Platform — with or without hardware
☁ CLOUD · 5 PLANTS LIVE

The complete Andon software platform, from basic to premium feature packs. Run it on KVAR hardware, or deploy software-only on the tablets, TVs and PCs you already own. Cloud-based and web-enabled — see every line, in every plant, from anywhere.

  • Cloud dashboard: live status of every line and plant on one screen
  • Production counts, takt / turnaround time, shift counts and efficiency in real time
  • Downtime analytics: Pareto of reasons, MTTA / MTTR trends, shift comparisons
  • Role-based views for operators, supervisors and management
  • Feature packs from Basic to Premium — pay only for what you use
  • Integration-ready: connects to ERP / MES and KVAR Machine Pulse & Energy Pulse

Hardware optional: because KVAR builds both the electronics and the software, the Suite works equally well with our call stations and displays — or entirely without them.

ON THE FLOOR

Operator keypad call stations with LED department displays
Call stations + department displays. Operator keypads raise categorised calls; LED boards announce the department and line — while the tower lamp signals floor-wide status.
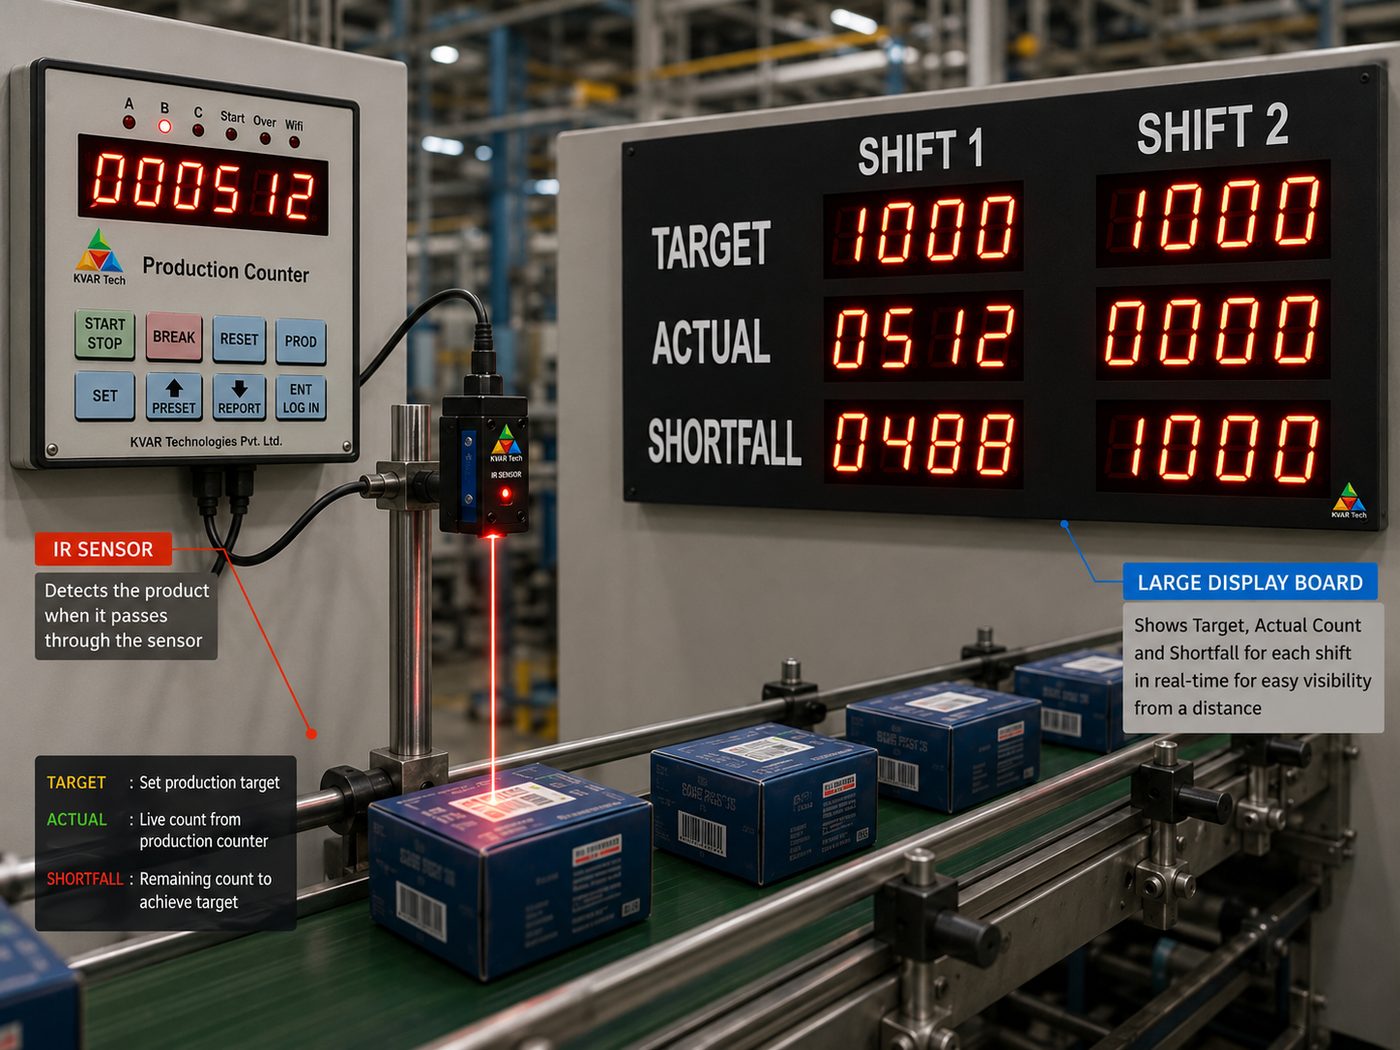
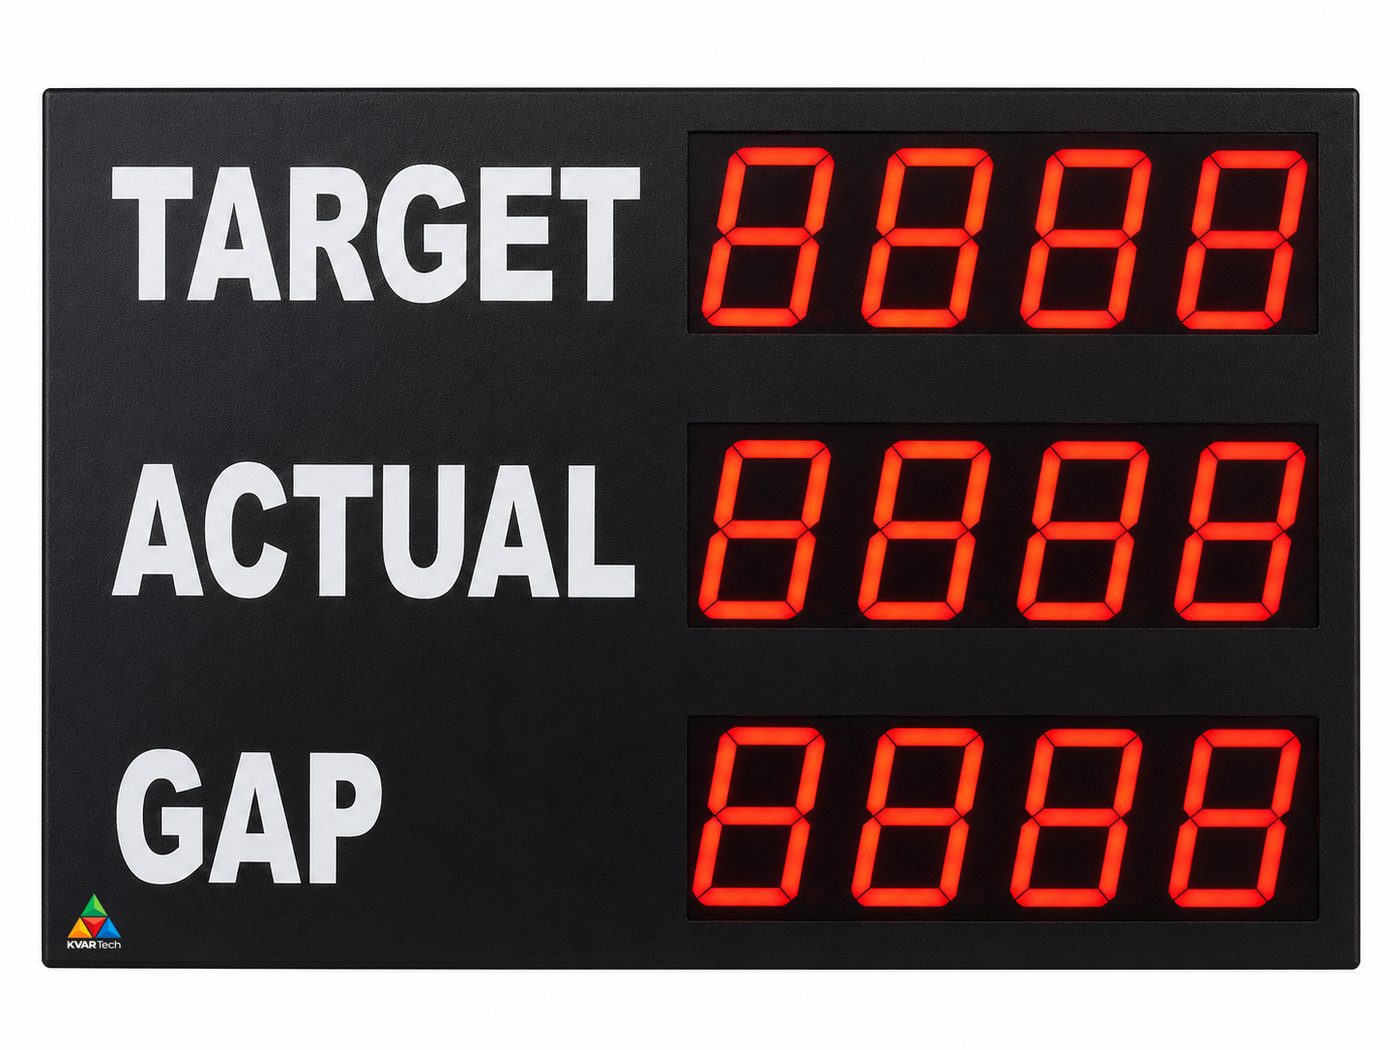
Central Andon display board showing live line status and counts
Central Andon display board. One glance tells the whole story: line status, production counts and targets — custom-built to your lines, sizes and viewing distances.

CHOOSE YOUR LEVEL

Capability matrix

Every level includes everything needed to work on its own. Higher levels add intelligence, reach and analytics.

CAPABILITY01 BASIC02 SELECT03 TOUCH04 SUITE
Tower lamp (red / amber / green)✓✓✓OPT
Push-button call stations✓✓OPTOPT
Keypad with call categories–✓OPTOPT
LED display boards (custom-built)–✓✓OPT
Touchscreen call stations––✓OPT
Built-in memory / logging–✓✓✓
Email / SMS / mobile alerts–OPT✓✓
Person-wise routing + auto-escalation––✓✓
Shift / daily / weekly / monthly reports–✓✓✓
MTTA / MTTR response analytics––✓✓
Multi-plant view–––✓
Cloud dashboard, web-enabled––OPT✓
ERP / MES integration–––✓
Works without any KVAR hardware–––✓
✓ IncludedOPT Optional add-on– Not applicable

Hardware feature analysis

The same comparison for what goes on the floor. Every level is a complete installation; the difference is how much the device itself decides, and how much reaches the network.

HARDWARE01 BASIC02 SELECT03 TOUCH04 SUITE
SignalingTri-colour tower lamp, optional buzzerTower lamp + custom LED display boardTower lamp + display + touchscreenAny of the above, or none
Raising a callPush-button call stationKeypad with call categoriesTouchscreen with fault & sub-fault pickerScreen, tablet or phone
Fault categories— no categoriesFixed categories on the keypadFault and sub-fault hierarchyFault and sub-fault hierarchy
Where the logic runsOn the panel — no softwareOn the device, event memory on boardOn the device, synced to the serverOn the server
EnclosureIndustrial-grade, shop-floor ratedIndustrial-grade, shop-floor ratedIndustrial-grade, shop-floor ratedNot applicable
MountingMachine or line-sideWall-mount or hangingWall-mount or hangingExisting screens
Display sizesLamp only0.5″ to 12″ digits, built to the throw distance0.5″ to 12″ digits, plus touchscreenExisting screens
ConnectivityButton contactWired, plug and playRS485 / Ethernet / wi-fiYour network
Inputs from plant equipmentButton contactPLC, proximity and dry contactPLC, proximity and dry contactServer-side
Event memory on device—YesYesServer-side
Installation timeHoursA day per lineA day per lineNo installation
Works with third-party hardware—Selected devicesSelected devicesYes — any trigger source

INSIDE THE SYSTEM

Hardware components

Every KVAR Andon deployment is assembled from three families of hardware — the stations where operators raise calls, the displays and signals that broadcast status, and the sounders that demand immediate attention.

01 Call stations & inputs

Placed at the machine or line, where operators input status and raise alerts.

🟊
Push-button call stations
LEVEL 01
  • Simple, rugged physical push-buttons designed for harsh shop-floor conditions
  • Plug-and-play wired installation — no PC, network or training required
⌨
Keypad operator stations
LEVEL 02
  • Hardware keypads with configurable call codes per department
  • Typical codes: Maintenance, Quality, Stores, Delivery Inspection — set to match your plant
🖥
Industrial touchscreen stations
LEVEL 03 · 04
  • Interactive touchscreens for selecting detailed call categories and entering specific reason codes
  • Operators also view live line status right at the station
📱
Your existing hardware
LEVEL 04 · OPTIONAL
  • Third-party tablets, PCs or existing workstations as call stations
  • Uses KVAR’s software-only option — no new hardware purchase needed

02 Visual displays & control signals

Broadcasting line status, call types and production metrics across the floor.

🚨
Tri-colour LED tower lamps
ALL LEVELS
  • Instant, at-a-glance status per machine or line
  • Red — stopped / immediate attention; Amber — waiting / held up; Green — running / normal production
🔢
LED dot-matrix display boards
LEVEL 01 · 02
  • Bright, custom-built LED boards displaying specific text alerts
  • Announce which department is needed on which line — e.g. DELY-INS · LINE 6
📺
Central Andon display boards
LEVEL 02 · 03 · 04
  • Large-format overview boards, customised to your plant’s viewing distances, sizes and layouts
  • Live multi-line data: line status (RUN / STOP / WAIT), production counts, targets and takt time
💻
Commercial TVs & displays
LEVEL 04 · CLOUD
  • Web-enabled TV screens, monitors or management dashboards
  • Run the cloud-based web software — any screen becomes an Andon display

03 Auditory & alert hardware

When a call must be heard, not just seen.

🔊
Audible buzzers
LEVEL 01 · OPTIONAL
  • Integrated sounders for immediate, audible floor alerts the moment a call is raised

THE SOFTWARE

The board shows the problem. The software makes sure it gets solved.

A lamp tells the floor something is wrong. The Andon software decides who is told, how long they have, what happens when that time passes, and what the plant learns from it afterwards. It runs on our devices, on the ones you already have, or on no devices at all.

OPTION 01

With KVAR devices

Call stations, tower lamps and LED Andon boards from us, wired to the software out of the box. One supplier for the button on the line and the number to call when something needs attention.

OPTION 02

With your existing devices

Already have call buttons, tower lamps, displays or a PLC raising alerts? The software takes its triggers from them. Your hardware stays where it is and keeps doing its job — the change is that every call is now routed, escalated and recorded.

OPTION 03

Standalone, no hardware

No buttons and no boards. The operator raises the alert from a screen at the workstation, a shared tablet or a phone, and everyone downstream works exactly as they would otherwise. The usual way to start on a line where installing hardware would slow the decision down.

HOW THE ESCALATION IS MEANT TO WORK

Lower roles act, middle roles control, senior roles improve and decide. An alert is raised, acknowledged and resolved on the floor; if it sits past its agreed time it climbs to the supervisor, and what keeps climbing becomes the improvement agenda for the department head and the manager. Nobody has to remember to chase — the clock does it.

Six roles, each seeing only what they can act on

ALERTS

Operator

Raises the alert and closes it once resolved. Sees their own workstation only — no dashboard to interpret, no comparisons to make.

ACTS

Resolver

Acknowledges, resolves or reassigns what is assigned to them, and records the root cause. Sees the queue of work, not statistics.

CONTROLS

Department supervisor

Watches their department in real time: what is open, what has escalated. Is the one who can force a close and reassign.

CONTROLS

Plant supervisor

The same control across every department, plus the alerts that stopped production and the authority to approve a forced closure.

REVIEWS

Department head

Reviews weekly and monthly rather than minute to minute: which faults keep coming back, which workstations are chronic, whether closures actually held.

DECIDES

Manager

The only plant-wide comparative view — department against department, SLA compliance, mean time to resolve, and the few that cost the most by far. Sets where the next fix belongs.

Four layers, kept deliberately separate

OPERATE

Dashboards

The current state of the floor, for the role looking at it. Live, and nothing more than live.

EVIDENCE

Reports

The factual record — filterable and downloadable — of what was raised, by whom, how long it took and how it closed.

REASONING

Analytics

Derived from the reports, never from live events: ageing, SLA breaches, recurrence, repeat offenders, MTTA, MTTR.

AT A GLANCE

Charts

Pictures of the reports and analytics. They calculate nothing, and they appear only where a picture changes what someone does.

Three versions — buy the behaviour you need

TIER 1 · BASIC

See it and act on it

Raise, acknowledge, resolve, close — with open and close timestamps. The plain record, where before there was none.

TIER 2 · MID

Hold it to a time

Adds the clock: response times, escalation when they are missed, forced closure with a reason, and root cause on resolution. This is where accountability starts.

TIER 3 · ADVANCED

Stop it coming back

Adds prevention: recurring faults, chronic workstations, whether a closure held, shift against shift, Pareto and MTTR for the manager.

Technical specification

MODELLING

Call → acknowledge → resolve → close, with the system stamping the time at every stage. Status is colour-coded throughout, and faults are raised against a fault and sub-fault category rather than free text.

SEVERITY

Low, medium and high, each with its own response and resolution thresholds. Thresholds are configurable, not code — set per plant and changed without a release.

ESCALATION MATRIX

Level 1 resolver and operator; Level 2 adds the department-in-charge; Level 3 adds the plant manager. An alert climbs automatically when its threshold passes, and the climb itself is recorded.

NOTIFICATIONS

E-mail at every escalation step as standard; SMS and WhatsApp with gateway charges payable to the messaging provider.

MODULES

Operator, resolver / department, supervisor, admin. Users, SLA settings, escalation rules and reports; exportable to Excel and PDF.

SECURITY

Role-based authentication, encrypted password storage. HTTPS for all API traffic, and audit logs for compliance. VAPT certification from Tier 2.

DEPLOYMENT

Private cloud or on-premises. Scope is licensed by workstation, department and notified user, and extends pro-rata as the plant grows.

COMMISSIONING

Four phases — requirement finalisation, installation and configuration, training and user-acceptance testing, then go-live with stabilisation support. Typically four weeks from order.

Software feature comparison

SOFTWARE FEATURETIER 1 · BASICTIER 2 · MIDTIER 3 · ADVANCED
Call → acknowledge → resolve → close✓✓✓
Colour-coded status (open / acknowledged / resolved / closed)✓✓✓
Automatic timestamping at every stage✓✓✓
Fault and sub-fault categorisation✓✓✓
Escalation workflow (Level 1 → 2 → 3)–✓✓
E-mail notification at each escalation step–✓✓
WhatsApp / SMS messaging (gateway charges payable to provider)OPTOPTOPT
Role-based authentication and audit logs✓✓✓
Dashboards — operator, department, supervisor–✓✓
Daily alert, response time, resolution time and escalation reports–✓✓
Configurable escalation rules and SLA thresholds–✓✓
Heat maps and trend charts––✓
User performance tracking––✓
Extended reports — workstation and department efficiency––✓
VAPT certification–✓✓
Reassignment of faults–✓✓
Root cause analysis (RCA)––✓
Multi-plant and multi-location monitoring––✓
Cross-department dashboards––✓
MTTR / MTBF analytics––✓
AI-driven trend prediction––✓
ERP / MES integration––✓
Mobile dashboards––✓
Custom KPI dashboards––✓

Access is enforced in the software, not in the interface: what a person sees is fixed by the role and department they log in with, and cannot be widened from the screen. Versions are gated the same way, so upgrading is a switch rather than a reinstallation.

ON SCREEN

Representative screens from a running deployment — the operator’s touchscreen at the line, and the management dashboard in the cloud.

Operator line board
At the line. Live line status, categorised calls and reason codes, raised and cleared at the station.
Management dashboard
In the cloud. Every line and plant on one screen, with downtime reasons, MTTA / MTTR trends and shift comparisons.

WHERE IT WORKS

Any floor with lines to run

Automotive & assembly

The industry that made Andon famous — expedite assembly cycles, catch defects at the station, and keep takt on target across sequenced lines.

General manufacturing

Any plant with multiple production lines: machining, electronics, pharma, FMCG, plastics. Categorised calls surface your true downtime reasons.

Warehousing & logistics

Monitor and manage packaging, kitting and storage operations — call for material, flag holds, and track throughput per station.

Proven where precision is non-negotiable: KVAR Andon systems run on assembly lines at aeronautics OEMs — environments where every call, every response and every record has to be right.

INDUSTRIES

Any plant that runs lines and cannot afford them to stop

Automotive & ElectronicsAeronautics & DefencePneumatics & Fluid PowerCement & Building MaterialsChemicals & FertilizersPharma & FoodFMCG & PackagingSteel & MetalsTextiles & Processing

Return on investment

Andon pays for itself in the downtime it prevents — and in the arguments it ends.

Less downtime — issues attended the moment they happen, not at the next round.
Faster response — the right person told in seconds; the clock escalates, not politics.
Fewer repeat faults — every stoppage becomes a Pareto bar for the improvement meeting.
Accountable shifts — who called, who resolved, how long it stood, on the record.
Management truth — the real performance of the floor, not a reconstruction.
One supplier — button, board and software from one team, one number to call.

From a light on the line — to a plant that fixes itself faster.

WHY KVAR

Hardware and software, one team

Engineered end-to-end

We design the embedded circuitry, the displays, and the software they talk to. No finger-pointing between vendors — one team owns the whole solution.

Custom-built displays

Boards are built to your lines, your sizes, your viewing distances and your call categories — not adapted from a generic catalogue.

MSME-friendly by design

Start at Level 01 for the cost of a tower lamp and a button. Every rupee you invest carries forward when you upgrade — nothing is discarded.

Part of a bigger picture

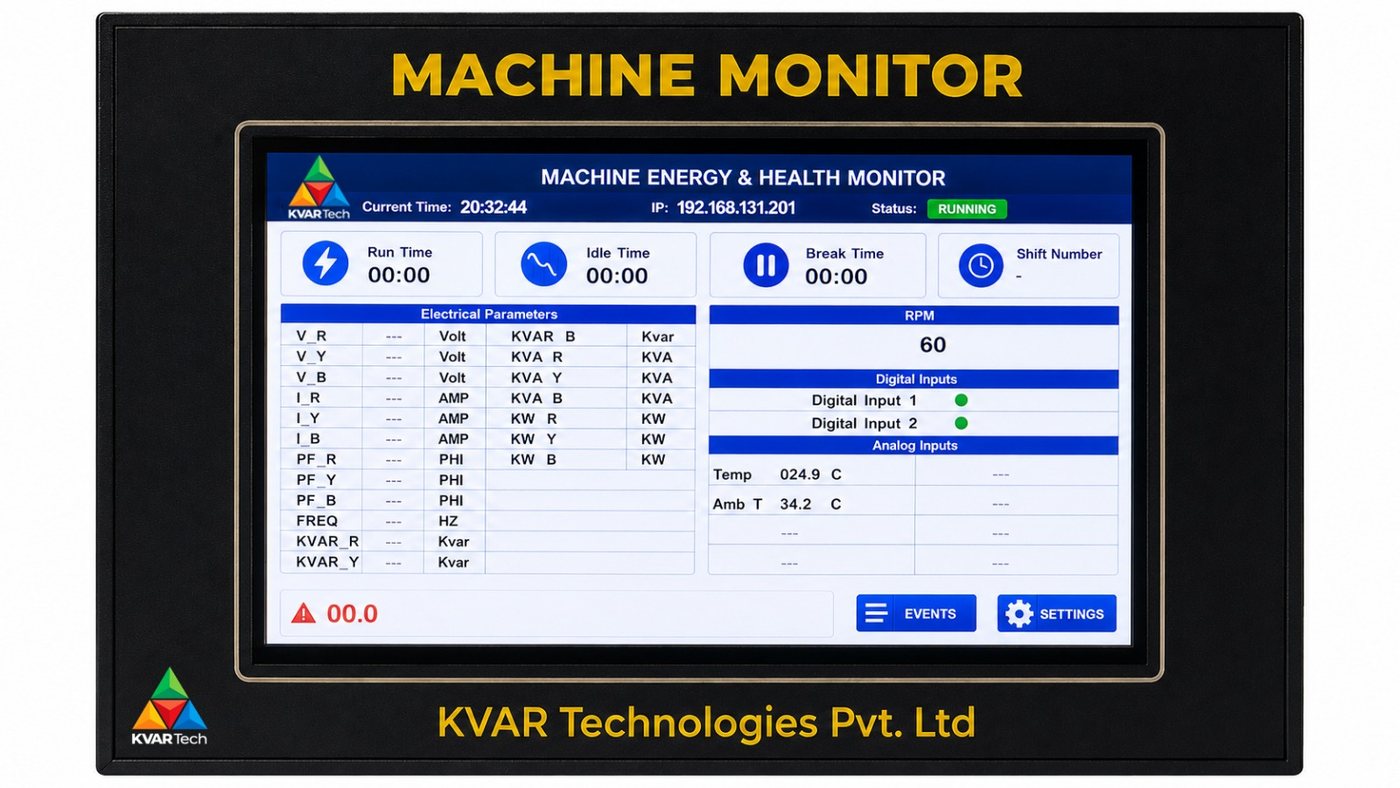
Andon is one module of KVAR’s Smart Factory range — it connects natively with Machine Pulse (OEE monitoring) and Energy Pulse (power & cost tracking).

NEXT STEP

See your line on an Andon board

  1. Tell us your lines, shifts and biggest downtime headaches
  2. We recommend a level and configure a live demo around your floor
  3. Pilot on one line — then scale at your pace
Send an Enquiry →
KVAR Technologies Pvt. Ltd. Kakad Industrial Estate, Mahim, Mumbai, Maharashtra, India
Phone: 022 6899 0651  ·  Email: sales@kvartech.com
www.kvartech.com
✉ Enquire