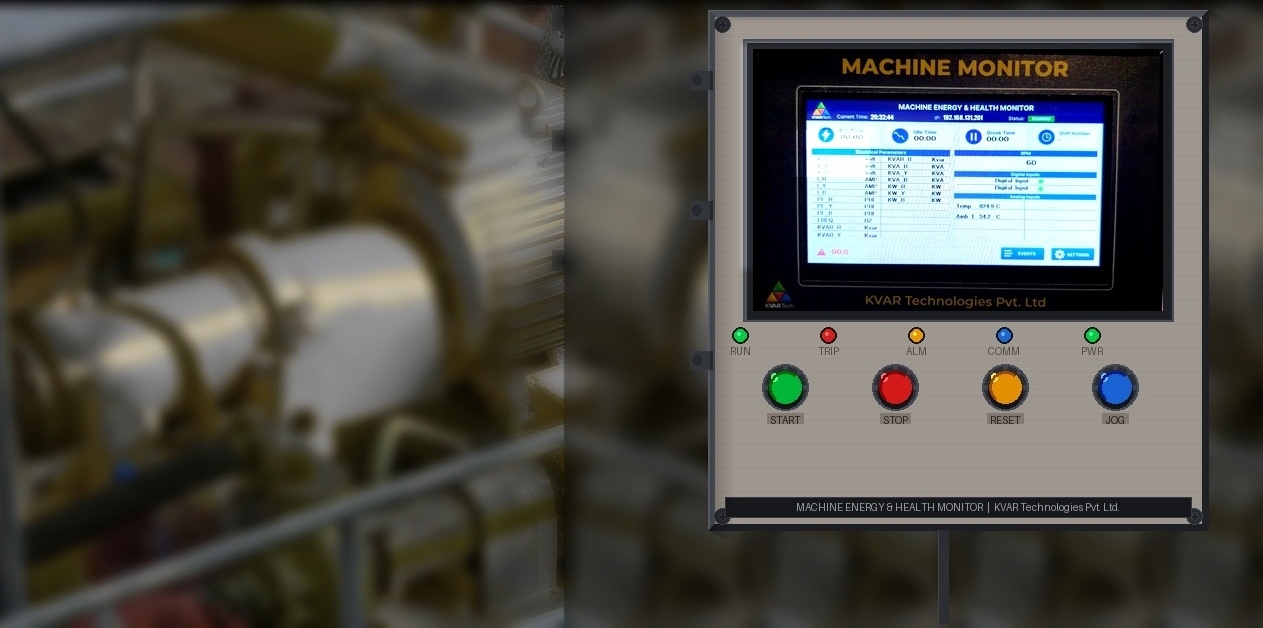
McMonitor is a compact, ruggedised unit that turns any production machine into a connected, self-reporting asset. Mounted at the machine, it continuously measures electrical energy, temperature, running speed and machine state — shows them on a local touchscreen and web dashboard, records them to on-board storage, and forwards them to the cloud. One trustworthy view of how each machine is really performing, for operator, supervisor and plant manager alike.

Is the machine healthy? Is it producing? How much energy is it consuming — and is that energy being used productively?
Configuration-driven. One firmware serves any machine; the parameters, sensors and thresholds are defined in a simple on-device configuration — no re-programming to commission a new installation, and a bad configuration can never disable the unit.
| Item | Specification |
|---|---|
| Controller | Industrial dual-core 32-bit processor, industrial temperature grade |
| Configuration | On-device configuration — parameters, sensors, thresholds; no firmware change to commission |
| Storage | On-board SD card for data and event logs; non-volatile storage for settings and event history |
| Real-time clock | Battery-backed — accurate time-stamping maintained across power cycles |
| Firmware update | Over-the-air (OTA) capable |
| Parameter | Detail |
|---|---|
| Interface | Modbus RTU (RS-485) or Modbus TCP/IP |
| Phases | Single-phase or three-phase (auto-detected or configured) |
| Measured | Voltage (per phase), current (per phase), power factor, kW, kVA, kVAR, frequency, energy |
| Compatibility | Configurable per parameter — supports a wide range of energy meters and formats |
| Display slots | Up to 24 electrical parameters |
| Parameter | Detail |
|---|---|
| Channels | 8 universal analog inputs + ambient (cold-junction) reference |
| Sensor types | RTD, thermocouple J / K / R / S / T, 0–100 mV |
| Interface | RS-485, non-blocking acquisition (no impact on the control loop) |
| Per channel | Type, scaling, name and alarm limits individually configurable |
| Diagnostics | Open-sensor detection (broken wire) and uncalibrated-reading flagging |
| Parameter | Detail |
|---|---|
| Digital inputs | Up to 4 — machine run signal, break, general-purpose events |
| Polarity / debounce | Active-high or active-low, debounce configurable per input |
| Speed (RPM) | Pulse / tacho input, period-timing measurement, configurable pulses-per-revolution |
| Item | Specification |
|---|---|
| Local display | Colour touchscreen — live values, status, settings and event history |
| Web dashboard | Built-in responsive web UI — live + historical, day / night theme, from phone or PC |
| Network | Wi-Fi (STA with AP fallback for commissioning) |
| Cloud | MQTT (encrypted) and HTTP — device registration, telemetry, remote configuration |
| On-site setup | Wi-Fi access-point mode for browser-based commissioning; no laptop software required |
Every parameter, sensor, threshold and display slot is in a simple on-device configuration — commission by editing configuration, not rewriting firmware. A companion builder generates valid setups.
A bad or partial configuration can never disable the unit. It validates on load, keeps a known-good backup, and always brings up its network and web interface — so a corrected configuration can be uploaded remotely.
Run / idle / break state (debounced), shift-wise runtime accounting, stoppage capture with an auto-inferred reason, and micro-stop vs true-downtime separation — the availability half of OEE, made honest.
Beyond metering: energy is related to production, exposing idle-energy waste, power-factor penalties and demand peaks — energy spend tied to actual output, not just measured.
Touchscreen and web dashboard are two views of one device — a setting changed on the screen is the setting the web shows. Live values, historical trends and the event log on both.
Encrypted MQTT and HTTP with server-driven registration. Data logs to SD regardless of connectivity, so a network outage never loses data.
A unified event engine watches every signal and raises a time-stamped event the moment something meaningful happens — routed to the on-screen log, the web dashboard, on-board storage and the cloud at once. Events survive power cycles, so the history before any incident is preserved. Events serve three purposes: predict breakdowns, maximise uptime, manage energy.
| Event | Purpose |
|---|---|
| Machine ON / OFF | Track every start and stop |
| Break start / end | Planned-break accounting |
| Shift start / over | Shift boundaries with runtime / idle / break summary |
| Stoppage start / end | Duration + auto-inferred reason (break / gap / fault / unclassified) |
| Minor-stop vs downtime | Micro-stop detection separate from true downtime |
| RPM stall | Machine running but shaft not turning — belt break, jam, locked rotor |
| Communication lost / restored | Meter or sensor link health |
| Power-on / boot | Detect unexpected restarts, with configuration-source record |
| Event | Detects |
|---|---|
| Phase loss | A supply phase dropping while others remain (three-phase) |
| Phase imbalance | Voltage or current imbalance across phases beyond a set limit |
| Over- / under-voltage | Sustained supply excursions that stress and shorten motor life |
| Over-current | Overload conditions |
| Over-speed | Shaft speed beyond a safe configured limit |
| Sensor fault | Open thermocouple / RTD (broken wire) and uncalibrated readings |
| Channel alarm set / clear | Any monitored value crossing its configured limit |
Analytical events that build on the same engine and each machine’s own operating history.
| Event | Predictive value |
|---|---|
| Energy per shift / per day | Energy consumption tied to each shift’s output |
| Idle-energy waste | Energy consumed while running but not producing — a key efficiency KPI |
| Peak-demand alert | Demand approaching a contracted or penalty threshold |
| Power-factor penalty | Sustained low PF that attracts utility penalties |
| Current / load drift | Rising running current vs learned baseline — bearing wear, friction |
| Power-factor decline trend | Gradual motor degradation |
| Baseline learning | The unit learns each machine’s normal, then flags departures |
Available shipping in current firmware · Roadmap designed on the same event engine, delivered in a subsequent release.
Reduce unplanned downtime — automatic stoppage capture with inferred reasons turns “it keeps stopping” into a ranked, quantified picture; RPM-stall, phase-loss and sensor-fault events surface problems early.
Cut energy cost — relating energy to production exposes idle-energy waste, power-factor penalties and demand peaks — the three most common avoidable costs.
Improve productivity & OEE — shift-wise runtime, idle and stoppage accounting delivers the availability half of OEE, with honest reason-coding.
Extend equipment life — under-voltage, phase-imbalance, over-current and (roadmap) current-drift detection catch the conditions that quietly shorten motor and drive life.
Fast, low-risk deployment — configuration-driven, browser-based on-site commissioning, fail-safe configuration, value at the machine on day one.
Local + cloud — useful standalone at the machine, with cloud analytics when you want them.
Machine Monitor (McMonitor) is configured to each machine — parameters, sensors, thresholds and display are set on-device. “Available” features ship in the current firmware; “roadmap” analytics are built on the same event engine and delivered in a subsequent release. Electrical measurement is via a Modbus energy meter. Contact KVAR Technologies for a demonstration and a configuration matched to your machines.