Every part counts. So does knowing why you lost the rest.
Production GeneAI turns your machine into a live OEE monitor — tracking output, targets, downtime reasons, shifts and efficiency, on the floor and in your pocket. It is the difference between counting production and improving it.
What an ordinary counter never tells you
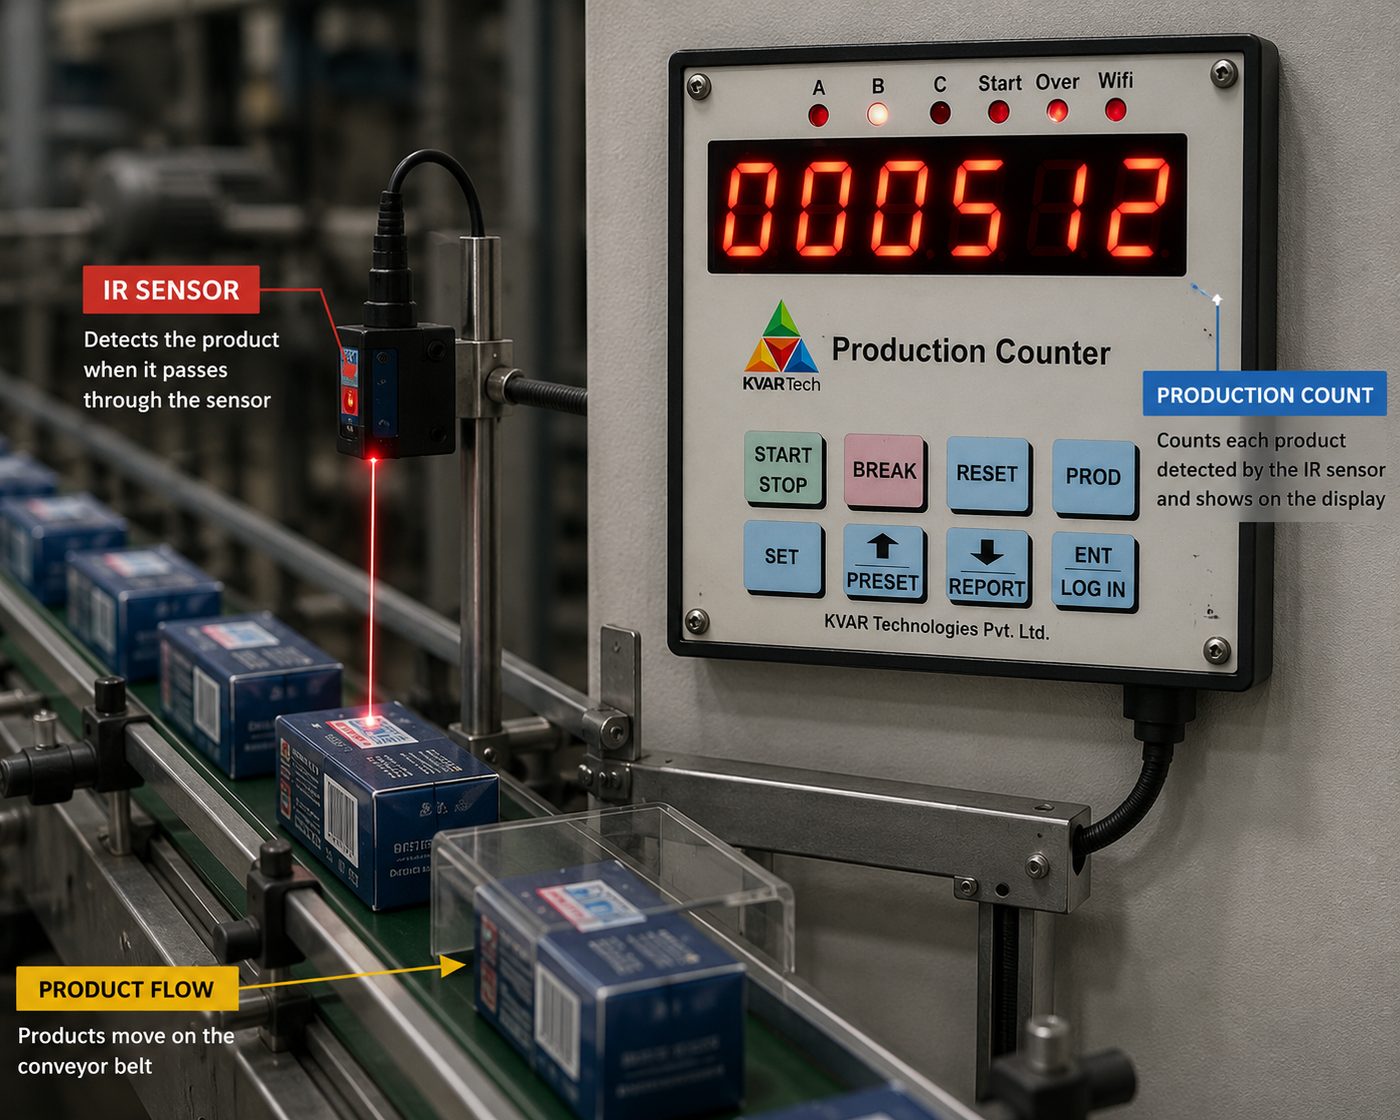
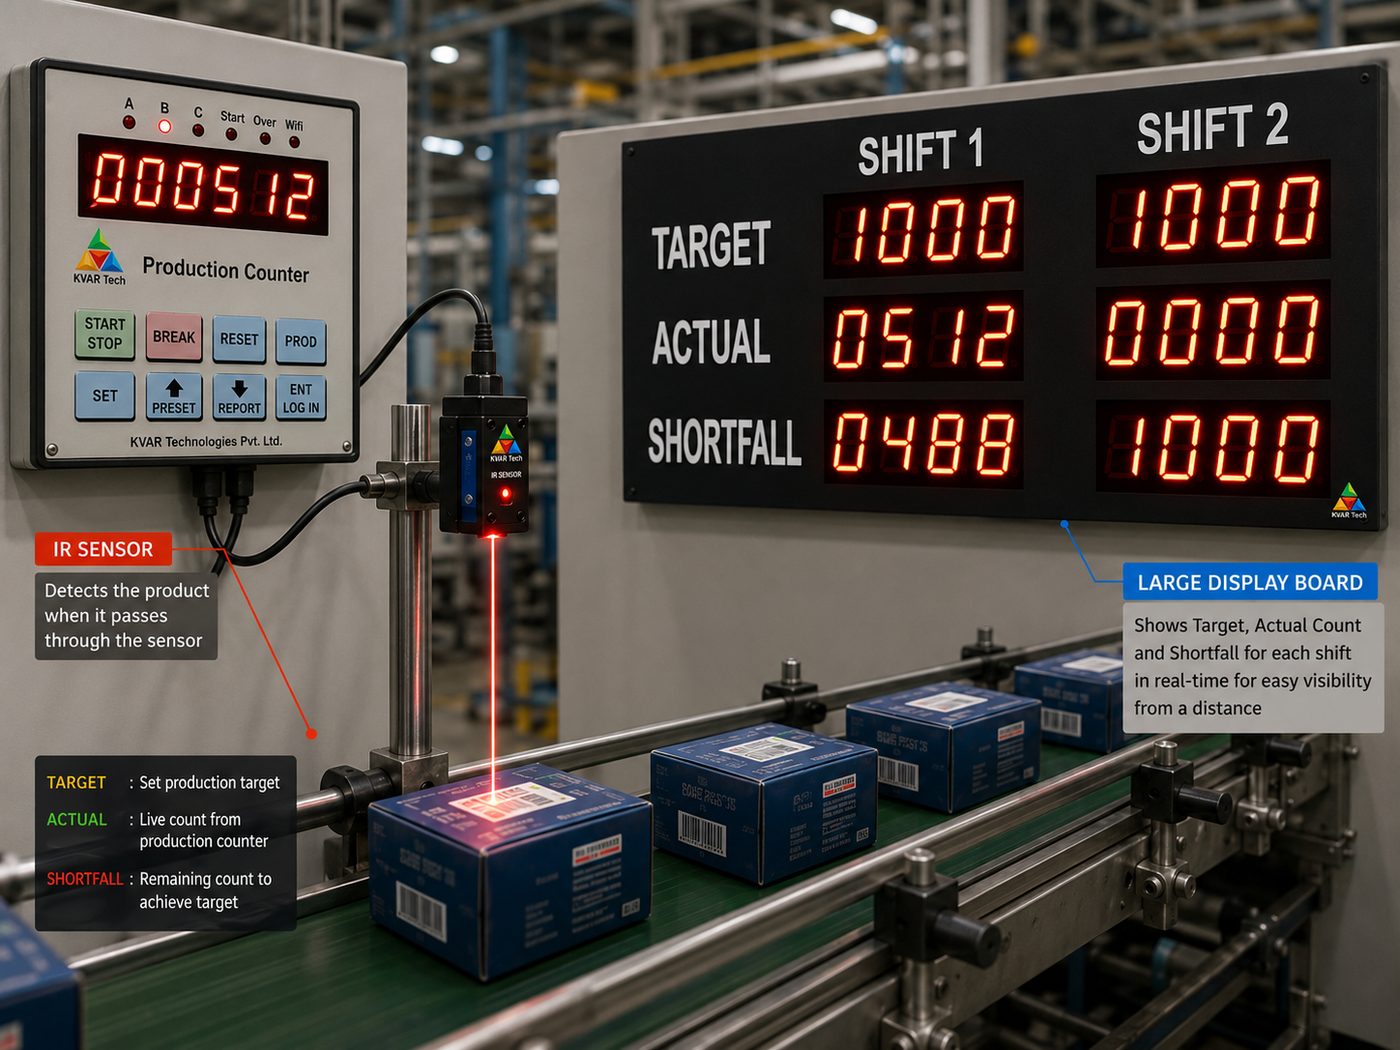
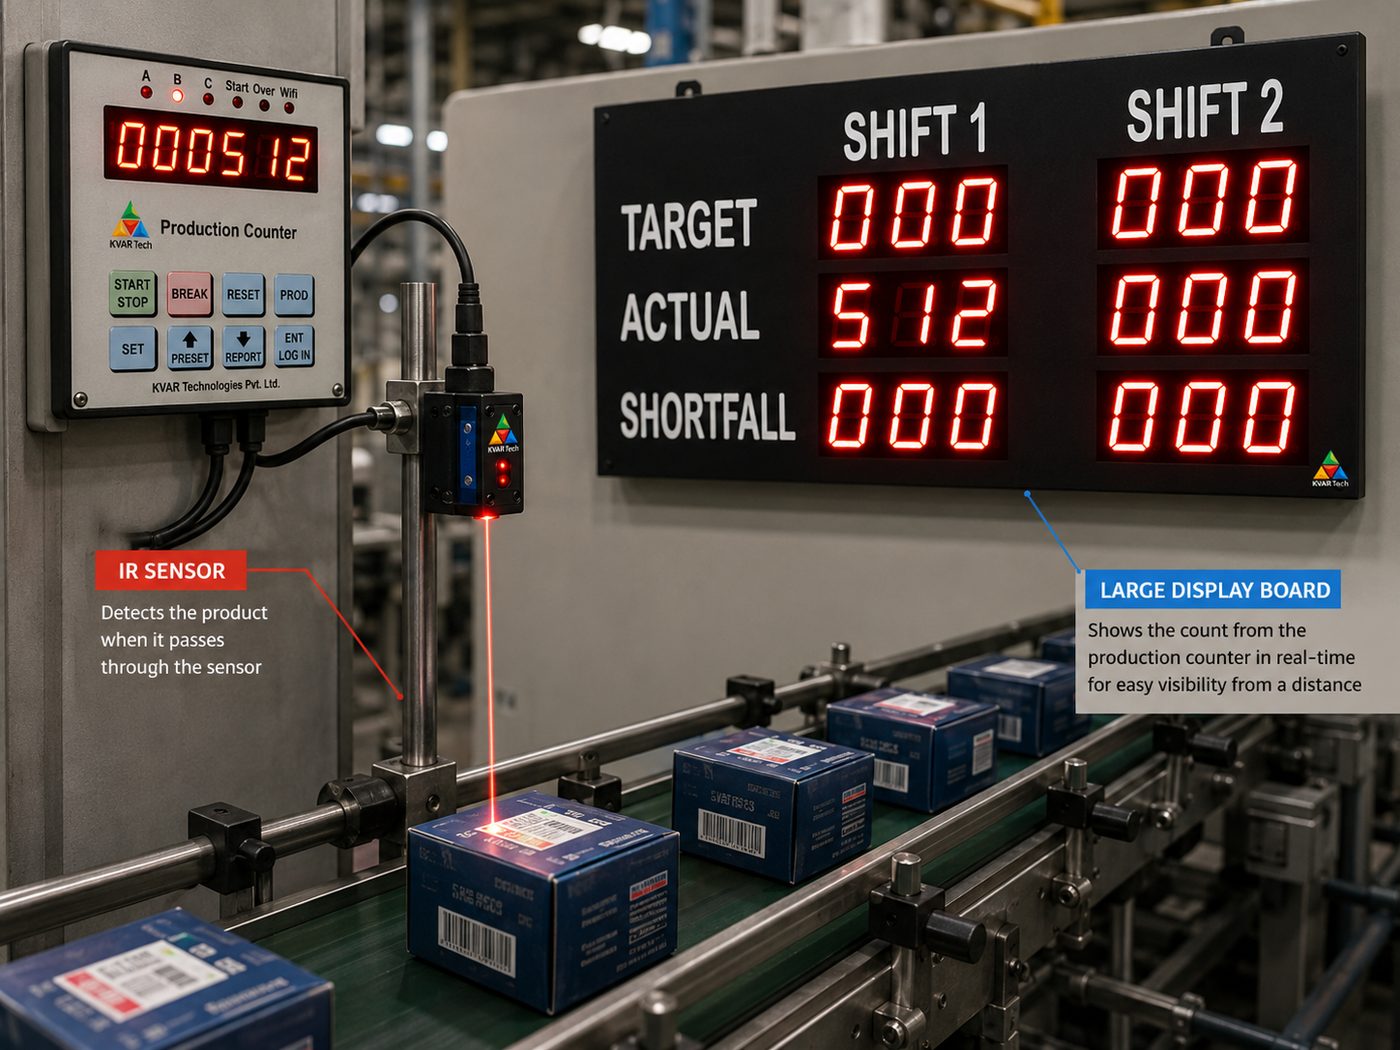
The same box on the same machine — but one of them can answer the question your supervisor actually asks.
| Capability | Ordinary counter | Production GeneAI |
|---|---|---|
| Tells you the count | ✔ | ✔ |
| Tells you the target & if you are on pace | — | ✔ |
| Tells you WHY the line stopped | — | ✔ |
| Tracks OEE / efficiency % | — | ✔ |
| Per-shift & per-operator data | — | ✔ |
| Live web dashboard & cloud reporting | — | ✔ |
| 8-hour trend, shift history, downtime log | — | ✔ |
| Grows with you — no rip & replace | — | ✔ |
The cost of not knowing. A counter shows how many. It never shows the hours lost to unplanned stops, the shift that underperforms, or the reason behind it. That blind spot is the most expensive line item you cannot see — and the one Production GeneAI puts in front of you every minute.
On the line
Made for the way your plant actually runs
Real OEE, live
Availability, performance and quality resolved into one efficiency number you can act on.
Downtime with reasons
Capture why the line stopped, not just that it did. Top-Loss analysis is built in.
Target vs actual
Live pacing against per-hour targets, per shift — know at a glance whether you will make the number.
Monitor from anywhere
Web dashboard, cloud and e-mail reports. Walk the floor, or watch from your desk.
A full OEE platform where a counter used to be.
A connected production monitor: hardware inputs into a real OEE engine, an on-board web server, cloud and MQTT connectivity and persistent on-device storage — in two form factors that share one firmware and one web interface.
OEE engine
Availability, performance, quality; run, idle, break and downtime states; per-shift OEE, rejects and efficiency.
Flexible inputs
Count, reject, reset and break channels; digital and opto-isolated; per-channel debounce; each input's function set by configuration, not by wiring.
Shifts & targets
Up to three shifts including a midnight wrap; configured and pro-rated hourly targets; target-mode relay control.
Connectivity
On-board web server; MQTT and HTTP cloud, AES-secured; e-mail reporting; UDP display feed.
On-device history
FRAM eight-hour ring and last-shift archive, plus SD-card session, hourly and downtime logs on the LCD model.
Downtime capture
Reason codes per stop and per break; Top-Loss aggregation; audit trail.
Integration & deployment
Web-first setup — every parameter configured from a browser, with instant save confirmation.
Robust storage tiers — FRAM for fast counters, EEPROM for settings, SD for long-term logs.
Secure cloud — AES-128 encrypted MQTT with device registration; HTTP push alternative.
Configurable break input — momentary or maintained, with adjustable debounce.
Operator control — numeric or credential login, break and product management on the device.
Multiplier support — scale pulses to display and target units for any counting ratio.
Standalone or connected — runs fully offline in NONE mode, or reports to your server.
Field-updatable — firmware and web assets serviceable in place.
One platform. Two models. Your choice of fit.
Same firmware, same web dashboard, same cloud. Pick the fit and the budget line by line, without learning two systems.
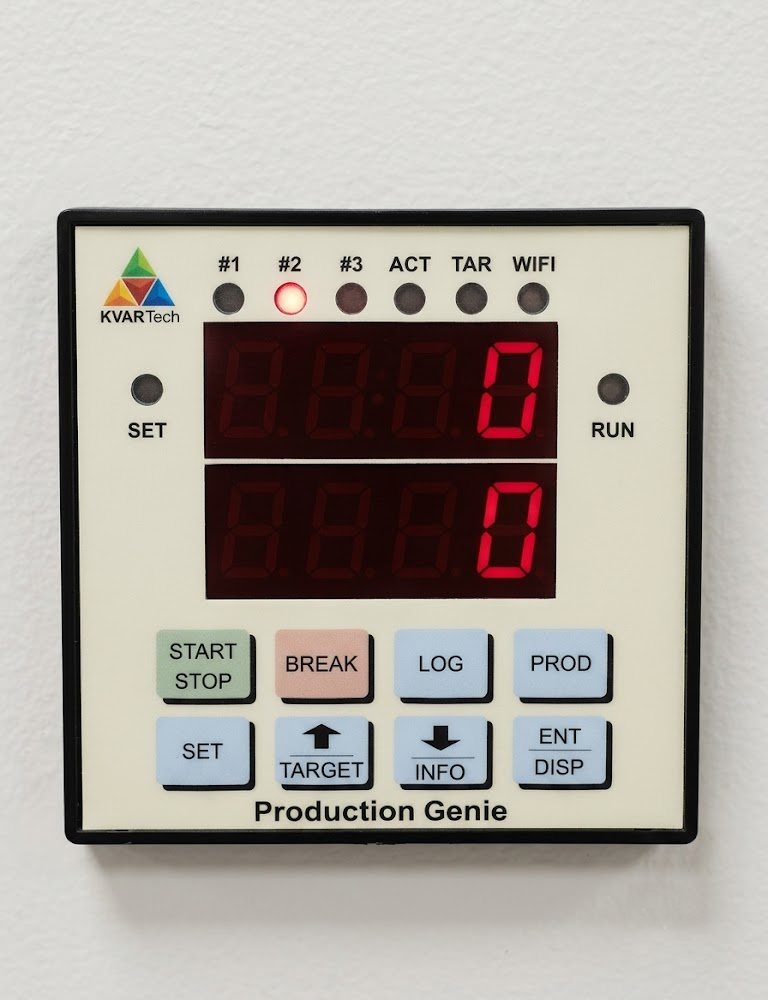
LED Model
- Large dual-row LED digits — count and target visible across the shop floor
- Rugged 8-key keypad operation — no touchscreen to damage
- Status lamps: shift, run, target and Wi-Fi at a glance
- Numeric login, product, break and target entry
- Same web dashboard and cloud as the premium model
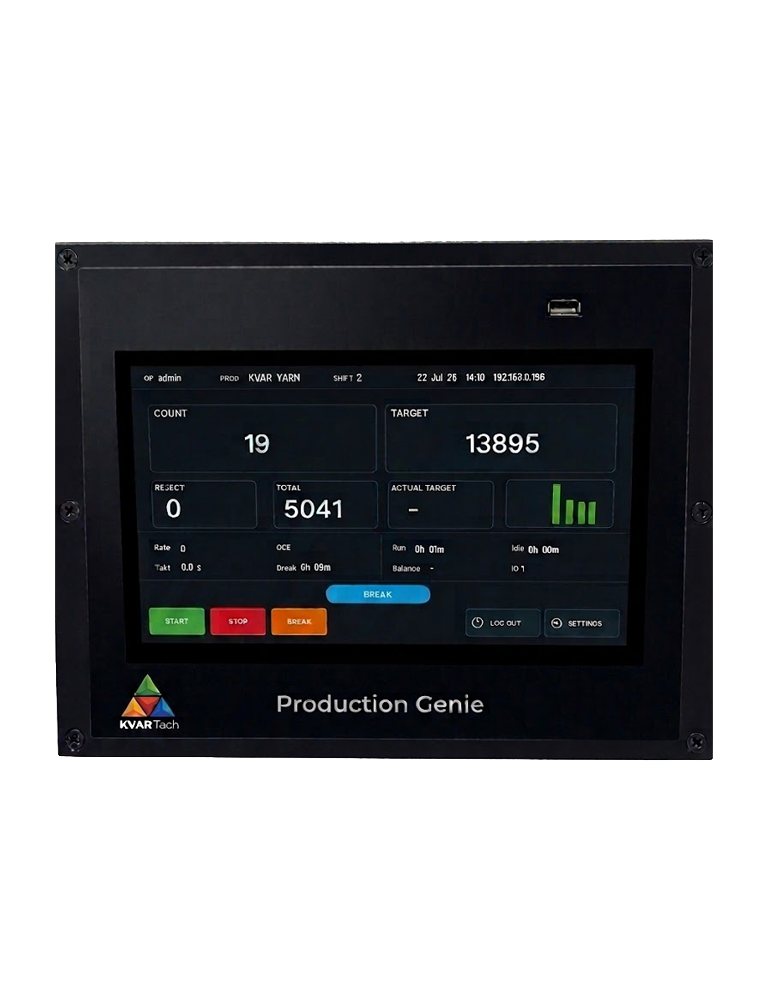
LCD Model
- Full-colour touchscreen dashboard on the machine
- On-screen reason picker, product and settings
- SD-card long-term history and Top-Loss analysis
- Richest on-device experience
- Same web dashboard and cloud as the LED model
Full dashboard, on-screen logs
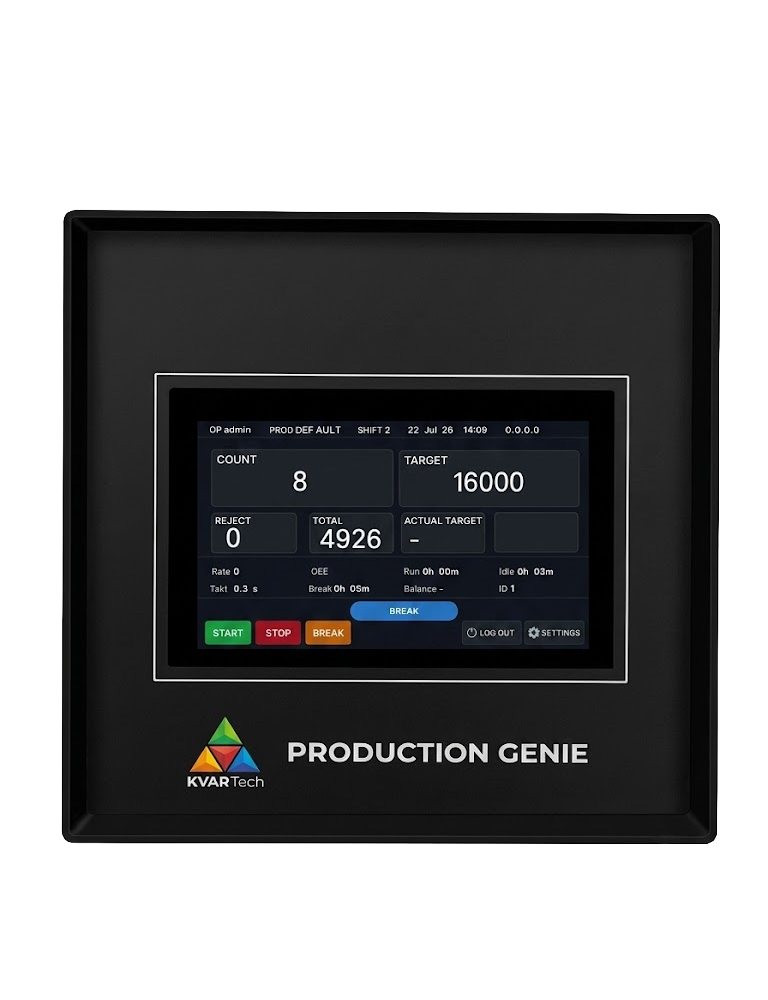
Compact panel, same platform
Seven-segment, shop-floor rugged
Model selection guide
| Consideration | LED model | LCD model |
|---|---|---|
| On-device display | Dual-row LED digits + status lamps | Colour touchscreen |
| Operation | 8-key keypad | Touch |
| Long-term on-device logs | Web / cloud + recent on-chip | SD-card history + Top-Loss |
| Floor visibility | High — large digits | On-machine |
| Environment | Rugged, no touchscreen | Interactive |
| Web dashboard & cloud | Yes | Yes |
What each feature does — and what you gain.
Every capability paired with the benefit it delivers, and the model that offers it.
| Feature | What it does | What you gain | LED | LCD |
|---|---|---|---|---|
| Production & output | ||||
| Live production count | Counts good parts in real time, with a configurable multiplier for any pulse-to-unit ratio. | Accurate output on the floor and on the web — no manual tallying, no miscounts. | ✔ | ✔ |
| Reject / quality count | Separately tracks rejected parts alongside good parts. | Your true quality rate, not just gross output — the Q in OEE. | ✔ | ✔ |
| Configured target | Sets the production target for the run or shift. | A clear goal on every line — everyone knows the number to hit. | ✔ | ✔ |
| Actual (incremental) target | A live pro-rated target that grows through the shift — the should-be-by-now figure. | Operators see whether they are ahead or behind at this moment — pace correction happens in real time. | ✔ | ✔ |
| Relay output | On-board relay driven by production events, such as target reached. | Trigger a lamp, buzzer, gate or machine action automatically — hands-free control. | ✔ | ✔ |
| Shift intelligence | ||||
| Shift tracking | Up to three shifts per day, including a shift that wraps past midnight. | Production is attributed to the correct shift automatically — fair, accurate shift-wise reporting. | ✔ | ✔ |
| Per-shift OEE & efficiency | Availability, performance and quality computed per shift. | Compare shifts objectively — spot the shift that underperforms, and why. | ✔ | ✔ |
| Overtime calculation | Production beyond the scheduled shift is tracked as overtime. | Fair, automatic overtime accounting — no manual timekeeping disputes. | ✔ | ✔ |
| Recent-shift history | The most recent completed shifts are retained on the device. | Recent performance available even without a PC or network — review at the machine. | ✔ | ✔ |
| Shift-wise data filing | Output, rejects, run/idle/break time and target are filed against the shift. | A complete shift record — the basis for accountability and improvement. | ✔ | ✔ |
| Downtime, losses & Andon | ||||
| Stoppage reason tracking | Every stop can capture a reason — numeric on LED, on-screen picker on LCD. | Know WHY the line stops — the single most valuable data a counter never gives you. | ✔ | ✔ |
| Top-Loss analysis | Downtime aggregated by reason over time. | Your biggest recurring losses, ranked — fix the costliest problem first. | — | ✔ |
| Run / idle / downtime states | The engine distinguishes running, idle and downtime automatically. | True availability measurement — the A in OEE, without manual logging. | ✔ | ✔ |
| Andon signalling | Break and stoppage states are signalled to a tower lamp or Andon display. | Supervisors see line status across the floor at a glance — faster response. | ✔ | ✔ |
| Audit trail | Key events are logged for review. | Traceability for disputes, audits and continuous-improvement reviews. | — | ✔ |
| Breaks | ||||
| Breaks during a shift | Scheduled and operator breaks are recognised and excluded from downtime. | Planned breaks do not unfairly hurt your OEE — numbers reflect real performance. | ✔ | ✔ |
| Break entry & exit confirmation | Entering and leaving a break is confirmed on the keypad or screen. | No accidental breaks; break time is logged deliberately and accurately. | ✔ | ✔ |
| Break reason (connected modes) | A break number or reason can be captured when connected. | Distinguish tea-break from changeover from maintenance — richer loss analysis. | ✔ | ✔ |
| External break input | A hardware break switch or button can trigger a break directly. | Wire in an existing break signal — the operator need not touch the unit. | ✔ | ✔ |
| Momentary or maintained break input | The break input works as a push-button or a latching switch, with adjustable debounce. | Fits whatever break hardware you already have — no rewiring, no false triggers. | ✔ | ✔ |
| History, time & trends | ||||
| Last-8-hour production tracking | Hourly output for the last eight hours is stored on-device and graphed. | Spot the hour when things slowed — a live pulse of the line, even without a card or PC. | ✔ | ✔ |
| Built-in SD card storage | Daily session, hourly and downtime data stored to an on-board SD card. | Deep day-by-day history retained on the device — nothing lost. | — | ✔ |
| NTP time synchronisation | The clock synchronises automatically over the network. | Every record carries the correct time — accurate, tamper-resistant timestamps across all units. | ✔ | ✔ |
| Downloadable reports | Records can be downloaded from the built-in web page. | Get data into Excel without pulling a card — reporting made easy. | ✔ | ✔ |
| Operators & access | ||||
| Operator login | Mandatory numeric or credential login before operating. | Output and events are tied to who was running the line — accountability. | ✔ | ✔ |
| Product selection | Select the running product; the name shows on the web and remote view. | Production is recorded against the right product — correct product-wise data. | ✔ | ✔ |
| Role-based web access | Admin-protected settings; operators cannot change configuration. | Settings stay safe from accidental change on the floor. | ✔ | ✔ |
| Connectivity & monitoring | ||||
| Built-in web dashboard | Every unit serves its own live dashboard and settings pages over Wi-Fi. | Monitor and configure from any phone or PC — no extra software to install. | ✔ | ✔ |
| Cloud reporting (MQTT / HTTP) | Secure, AES-encrypted push of production data to a central server. | Roll up many machines to one place — plant-wide visibility. | ✔ | ✔ |
| E-mail reporting | Reports can be delivered by e-mail. | Shift and production summaries arrive automatically — no one has to fetch them. | ✔ | ✔ |
| Remote production display | Output can be mirrored to a large remote LED display. | Show live numbers to the whole floor, or to a supervisor's office. | ✔ | ✔ |
| Standalone or connected | Runs fully offline, or reports to the cloud — your choice. | Works with or without IT infrastructure — deploy anywhere, expand later. | ✔ | ✔ |
| Reliability & fit | ||||
| Tiered on-device storage | Fast-write memory for counters, durable memory for settings, card storage for logs. | Data survives power cuts; the right store for each job — robust in a factory. | ✔ | ✔ |
| Save confirmation | Every web setting change confirms success or shows the exact error. | No guessing whether a change took — fewer setup mistakes. | ✔ | ✔ |
| Configurable inputs | Each input's role — count, reject, reset or break — is set in software. | Adapt to any machine's signals without rewiring — flexible installation. | ✔ | ✔ |
| Two models, one platform | Economical LED or premium LCD — same firmware, same web, same cloud. | Pick the fit and budget per line without learning two systems. | ✔ | ✔ |
LED — economical bright-digit floor display with keypad. LCD — premium colour touchscreen. ✔ included — not on this model. Both models share the same firmware, web dashboard and cloud.
Why it pays for itself
Recover lost hours — see and fix the downtime you are paying for today.
No rip-and-replace — the "future" features are here now; switch them on when ready.
Hold every shift accountable — per-shift, per-operator output and rejects.
Faster decisions — data at the machine, on the web, in your inbox.
Buy once, grow later — web, cloud and reporting are already inside.
Marginal hardware step — category-level capability for close to counter money.
Production GeneAI is a smart OEE production-monitoring platform by KVAR Technologies. Features described reflect current product capability and may be extended. Contact us for a demonstration, interface details, protocol documentation, evaluation units, or a capability matrix matched to your requirement.